What do we learn from so many daily measurements?
What is the big advantage of a 'daily study'?
Read moreWhat do we learn from so many daily measurements?
People are dynamic and they live and find themselves in (social) environments that can strongly differ for each moment. This affects the way we feel and act at that moment. But how can we measure these daily changes? We do that with an online diary study. Multiple times a day, and multiple days in a row, participants receive a pop-up message to fill in a couple of questions on their mobile phone.
The big advantage of such a ‘daily study’ is that we can measure human behaviour and feelings in realtime and in the social environment they find themselves in. The realtime measurements prevent that people have to fill in questions about the past and reduce the chances of false memories. We simply ask: How lonely do you feel at this moment? Or: How energetic are you at this moment?
Because we ask these type of questions multiple times a day, we get insight in a large amount of measurements within one person. That is interesting as it gives us information about small deviations in mood and behaviour during the day. It helps us answer questions like: What is the effect of a strong changing mood during the day on later behaviour or self-confidence?
The positive aspect of this method is that you can analyse ‘within’ a person, as a score of 4 (on a 10 point scale) might be a high score for person X (as person X might always score a 1 or 2). Whereas a score of 4 can be very low for person Y (as person Y mostly scores 8 or 9). With this method we are able to add significance to individual patterns of changes in mood within a day or week.
With help of the Healthy Brain Study we are able to answer the questions mentioned above, but also questions like: In what social contexts do people feel more lonely (at work, being with friends, being at home with their family, when online)? The relation how stress is related to individual differences in changes in mood is also something that can be assessed. In short, this is a very important part of the study.
Dr. M. Verhagen, Associate Professor | Behavioural Science Institute | Radboud University
Why do we collect feces?
We are all carrying trillions of micro organisms with us, like bacteria. All together they are as heavy as our brain, namely 1.5kg! Most of the micro organisms are situated in our gut, where they play an important role in digestion and are crucial for a healthy immune system. Besides, bacteria also affect the brain indirectly. For example, mice that grow up in a sterile lab cage without any bacteria, show completely different behaviour compared to their siblings in a normal cage.
About half of our feces consists out of bacteria from our intestines. By collecting feces, we are able to find out what bacteria are carried and by whom. This may differ hugely between two people. We would like to couple these differences in gut bacteria to the brain activity that we measure during the MRI scans. Previous studies found relationships between the type of bacteria in the gut and brain activity. Unfortunately these studies only had a small group of partipants and had various results. As the relationship between gut bacteria and the brain is a relatively new topic in research, it is important that the results of a study are coherent and able to be repeated. Also, from the previous studies it is not clear what the combination of the type of bacteria and brain activity means.
With the Healthy Brain Study we aim to answer questions like: Do your gut bacteria predict how well you are able to cope with stress in daily life?
Dr. E. Aarts - Principal Investigator - Donders Institute for Brain, Cognition and Behaviour

MRI scans
What does the brain look like in our participants, and how does it function? To answer these questions, our participants undergo a 45-minute MRI scan. We measure brain structure using a T1-weighted anatomical scan, which we use to quantify differences in for instance
brain size, morphology, and composition. This is important, because it can help us understand what a healthy brain looks like. In addition to the gray matter of the brain, which contains the bodies of brain cells, the brain also consists of white matter that makes up the information “highways” of the brain. We measure these highways using Diffusion-weighted MRI, which can help us understand how they are “maintained” in healthy brains. We use Quantitative Susceptibility Imaging to measure the brain’s microstructural integrity. Finally, we measure how the healthy brain functions, and how its functioning is related to our other measures. We therefore use functional MRI during two “tasks”: in the first, participants watch a short film, and in the second, they undergo a so-called resting state scan during which they are asked to simply relax. These measures help us understand how the brain communicates when it is “at work” and when it is at rest.

ActivPAL
A crucial part of the Healthy Brain Study is that participants collect data about themselves for a week using a variety of devices provided by our team. One of these devices is the ActivPAL. This little gadget is attached to the upper part of the leg. In this position, it is capable of observing whether the wearer is inactive (sitting or lying down), standing, or active. This provides us with useful information about the level of physical activity of our study population. "My name’s Jasper Verkroost and I’m the Healthy Brain Study’s data manager. As part of my role, I got the opportunity to test one of the ActivPALs for 24 hours. I was a little concerned that wearing such a device would be very uncomfortable. In practice, I only sensed that it was there when I thought about it. Once the testing is complete, you simply connect the device to your computer using a USB cable. With the provided software you can then download the data from the device and start analysing it."
"My own output for day 1 is displayed above. Yellow represents inactive (sitting), blue inactive (lying down), green standing, and red active. Here's a little breakdown of my day: at 12:35 we had a walk with the Healthy Brain team (red), at 4:35 I cycled home (red), between 5:00-6:00 I prepared dinner (green/red), and from 7:00-11:00 I was working in my study at home (yellow). Finally, I did some cleaning up (green/red) before I went to bed at 11:45 (blue)."

Åstrand cycle test
This sub-maximal bicycle test was developed by the Swedish exercise physiologist Per-Olof Åstrand to estimate the maximum oxygen consumption (VO2 max) (± 10%) of a participant. The test is based on the relationship between exercise level, heart rate and the (maximum) oxygen consumption that the participant uses during exercise on a bicycle while the resistance (watts) increases, raising the heart rate to a standard level. At a certain resistance, the heart rate reaches a stable state, which remains more or less the same.
On the basis of this steady state heart rate and the test load, a prediction of the effort level is made. The participant cycles with an increased load until a heart rate of 180 beats per minute minus their age is reached. The effort level must be determined prior to the actual test. This level must not breach the lactate limit of the participant otherwise a steady state will not be achieved. The effort level is then maintained for 6 minutes with the aim of achieving a steady state at which point the heart rate is measured.
Empatica E4 wristband
How stressed are our participants? Read moreEmpatica E4 wristband
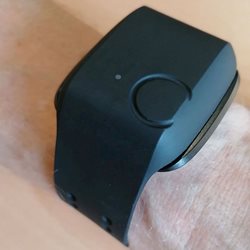
A crucial part of the Healthy Brain Study is that participants collect data about themselves for a week using a variety of devices provided by our team. One of these devices is the Empatica E4 wristband. This wristband looks like a smartwatch, with some added physiological feature recordings that make it useful for researchers.
These physiological features allow for assessment of autonomic nervous system parameters relevant to stress such as heart rate (variability), skin conductance, and skin temperature. This can potentially provide us with useful information about the levels of stress that are experienced by our study population. The wristband is a frequently used research device with proven, reliable recordings.
The output for one day is displayed below. EDA=skin conductance, BVP=blood volume pulse, Accelerometers=physical activity, HR from IBI=heart rate, temperature=skin temperature.
.aspx?width=1150&height=777&ext=.jpg&type=BlockColumn1Zoom1)
Socioeconomic decision-making tasks
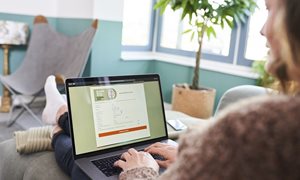
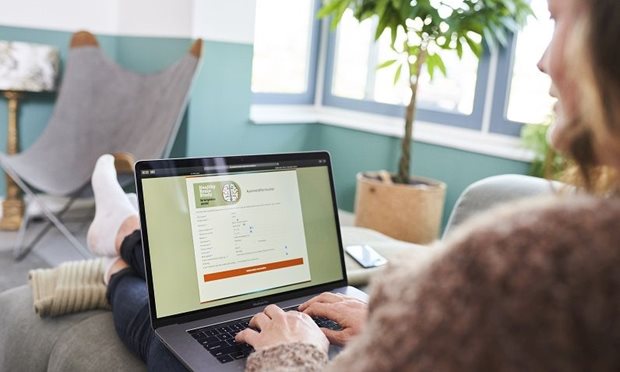
Would you rather receive 100 euros today, or 120 euros in a year? You probably have a preference over one of the options. These preferences can however vary widely between participants, and this variation is exactly what we are trying to capture with the Gorilla tasks. Read moreSocioeconomic decision-making tasks
Would you rather receive 100 euros today, or 120 euros in a year? You probably have a preference over one of the options. These preferences can however vary widely between participants, and this variation is exactly what we are trying to capture with the Gorilla tasks. These tasks consist mainly of interactive socioeconomic decision-making tasks that assess multiple factors such as risk-taking, patience and trust. The participants complete these tasks 3 times on their computer at home, with an interim period of 3 months. Subsequently, the researcher can use the results to create a basic socioeconomic profile of the participant. This profile can in turn be analysed together with other data derived from that participant, with potentially interesting results.
_2.aspx?width=792&height=659&ext=.jpg&type=BlockColumn1Zoom1)
Language in Interaction test battery
Language is what sets us apart from other species in the animal kingdom. Although we all have the ability to use language, we differ in that ability. Language skill is a key predictor of professional success and, more generally, of our functioning in society. Read moreLanguage in Interaction test battery
Language is what sets us apart from other species in the animal kingdom. Although we all have the ability to use language, we differ in that ability. Language skill is a key predictor of professional success and, more generally, of our functioning in society. The protocol of the Healthy Brain Study includes the ‘Individual Differences in Language Skills’ test battery, a collection of about 30 behavioral tests, all administered via the internet. The test battery assesses the language users’ skills in the main language tasks (word production/comprehension; sentence production/comprehension), the knowledge needed to carry out these tasks (e.g., vocabulary, formal rules of grammar), as well as more general cognitive skills that are likely to be involved in language use (e.g., working memory capacity, processing speed). Being able to relate language skills to the wealth of other behavioral and neuronal measures collected in the Healthy Brain Study is a unique opportunity for studying the implementation and organization of language in the brain as well as its interaction with other markers of physical and mental well-being.

Blood samples
To assess general health, genetic make-up, as well as markers that may have specific relations to the functioning of the brain, we take fasten blood samples. Read moreBlood samples
To assess general health, genetic make-up, as well as markers that may have specific relations to the functioning of the brain, we take fasten blood samples. We take 89.5 ml at the first lab visit and 83.5 ml at the second and third lab visit as collection for DNA is only required once. The Radboud Biobank handles the blood samples and stores DNA stock, 3 PAX gene tubes, 24 aliquots plasma EDTA, 6 aliquots serum, 12 aliquots heparin in a freezer at -80 degrees Celsius.

Computer task: the card game
The participants undertake a card game during the test days. During the card game, you turn cards over to win or lose points. You decide how many cards you want to turn over without knowing which are winning or losing cards. In this way, we measure how much risk you're willing to take. Read moreComputer task: the card game
The participants undertake a card game during the test days. During the card game, you turn cards over to win or lose points. You decide how many cards you want to turn over without knowing which are winning or losing cards. In this way, we measure how much risk you're willing to take. You can decide when to stop unless you turn a losing card over, then the round stops automatically. You're playing for money so the prize is real! The game therefore requires your full attention. Any money won will be transferred to your account as part of your overall payment at the end of the research period. Luckily, you don't have to pay us any money if you lose. The points won, and therefore the money that you earn, differ widely per person. This is dependent on chance and luck.
Reward based motor learning
Some of us are very exploratory in our motor behaviours, whereas others are much more conservative and thus exploit current action strategies. In this experiment we quantify how explorative versus exploitative subjects are in a motor learning task and compare these outcomes to other personality traits from the Healthy Brain Study. Read moreReward based motor learning
Some of us are very exploratory in our motor behaviours, whereas others are much more conservative and thus exploit current action strategies. In this experiment we quantify how explorative versus exploitative subjects are in a motor learning task and compare these outcomes to other personality traits from the Healthy Brain Study.
Subjects are asked to hit a visual target by moving the handle of a robotic interface. They don’t see their hand and are informed that they have hit the target through the receiving of a reward. Unknown to the subject, the reward region slowly drifts away from the actual visual target location. The reward consists of a fun firework explosion originating from the target and a target miss results in a ‘shivering’ of the target. Using computational modelling we can now quantify how much a subject increases exploratory variability after a non-rewarded trial and exploits the action knowledge from a rewarded trial.

Stimulus–response compatibility (SRC) task
Alcohol use is one of the most common health risk behaviors in the target population of the HBS. Implicit processes, such as whether or not you have the tendency to approach or avoid alcohol, may influence alcohol use and related health outcomes. Therefore, we implemented the stimulus–response compatibility (SRC) task to measure individual differences in the alcohol approach bias. Read moreStimulus–response compatibility (SRC) task
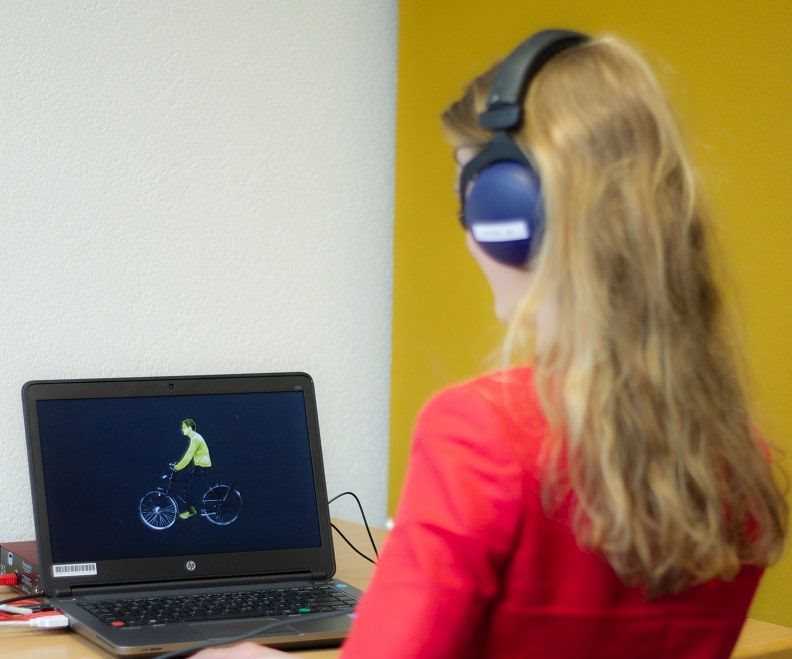
Alcohol use is one of the most common health risk behaviors in the target population of the HBS. Implicit processes, such as whether or not you have the tendency to approach or avoid alcohol, may influence alcohol use and related health outcomes. Therefore, we implemented the stimulus–response compatibility (SRC) task to measure individual differences in the alcohol approach bias. The task includes two picture categories, i.e., pictures displaying people drinking alcohol or soda. Participants are instructed to either approach or avoid the alcohol picture by moving a manikin towards or away from the pictures. Previous research has shown that alcohol consuming groups are quicker to let a manikin move towards alcohol compared to moving away from alcohol.

Wristbands as a low-tech wearable
to characterize direct contact with chemicals Read moreWristbands as a low-tech wearable
Wristbands as a low-tech wearable to characterize direct contact with chemicals
In the development of wearable high-tech sensors the silicon wristbands is a comparative low-tech solution. As a wearable the wristband option is well known and well accepted in the arena of citizens research. The ratio behind the use of wristbands is the capability of the silicon material to absorb chemicals from the environment.
This concept of the wristband as a personal diffusive sampler was first reported by O’Connel and co-workers in 2014 and was introduced in exposome studies (see https://images.app.goo.gl/GEwt7M3tyGggBboKA ). Applications have been developed for 1500+ chemicals. Chemicals retrieved from wristbands correlated well with serum levels. This makes the wrist band an affordable and well accepted alternative to the use of existing exposure monitoring. So far, the wristband has been used for chemicals like polycyclic aromatic hydrocarbons, phthalates, organo-phosphorous and brominated flame retardants, pesticides and a whole range of volatile organic compounds.
Before wristbands can be used for research purposes they need to be cleaned thoroughly and tested on the instrument of final analysis. Wristbands can be worn continuously for a period of 5-15 days. The exposure data reflect all direct contact with environmental chemicals, either solid, liquid or gas phase. The outcome of the wristband analysis does not provide any data on the source or exact time of exposure. If required these data should be retrieved by other means, e.g. questionnaires or diaries. Wrist bend analysis inform so-called aggregate exposures: combined exposure to a substance from different consumer products and different uses over time.
An interesting finding was reported by Aerts and co-workers (2018) in a study amongst primary school children in Belgium. The researchers analysed wristbands for pesticides and observed direct contact with 30 different pesticides including fipronil. This is a very persistent and neurotoxic insecticide that became well-known in the Netherlands from a recall of eggs from the shelfs of supermarkets after a contamination had been found that was traced back to the illegal use of fipronil in chicken farms. In the Belgian study children were probably exposed because of the use of fripronil in flea-collars in pets. This use of fipronil is not approved for the Netherlands.
References
Aerts R, Joly L, Szternfeld P, Tsilikas K, De Cremer K, Castelain P, Aerts JM, Van Orshoven J, Somers B, Hendrickx M, Andjelkovic M, Van Nieuwenhuyse A. Silicone Wristband Passive Samplers Yield Highly Individualized Pesticide Residue Exposure Profiles. Environ Sci Technol. 2018 Jan 2;52(1):298-307. doi: 10.1021/acs.est.7b05039. Epub 2017 Dec 13. PMID: 29185731.
O'Connell SG, Kincl LD, Anderson KA. Silicone wristbands as personal passive samplers. Environ Sci Technol. 2014 Mar 18;48(6):3327-35. doi: 10.1021/es405022f. Epub 2014 Feb 26. PMID: 24548134; PMCID: PMC3962070.